Market Analysis
Treasury Secretary Bessent Opposes Larger Fed Rate Hike
U.S. Treasury Secretary Scott Bessent has pushed back against calls for a larger Federal Reserve rate hike, even as Bitcoin fell below $60,000.
22/11/2026
Strategy's Investor Relations on Bitcoin Pullback, AI Impact
Strategy's Head of Investor Relations attributes Bitcoin's pullback to capital rotation into AI stocks, expecting a reversal and long-term gains from monetary debasement.
21/11/2026
Bitcoin Falls to $58,300 as Nasdaq Plunges 5% on Chip Selloff
Bitcoin's price fell to $58,300, a 6.2% drop, as the Nasdaq Composite plunged 5% due to a selloff in chip and AI stocks, with significant ETF outflows.
21/11/2026
Bitcoin Trades Like a Risk Asset Amid Fed Hikes
Tracy Shuchart states Bitcoin is trading like a risk asset due to tightening liquidity and a strong dollar, but its long-term scarcity argument remains unchanged.
21/11/2026
Anthropic IPO and Fed Rate Hike Fears Drive Bitcoin Below $62,000
Bitcoin fell to its lowest price since early July, dropping below $62,000, as the Anthropic IPO and fears of Federal Reserve rate hikes led to a broad market sell-off and significant ETF outflows.
20/11/2026
Strategy Shares Fall 6th Day as Bitcoin Dips Below $62,000
Strategy (MSTR) shares fell for the sixth straight day to $86.13 as Bitcoin dipped below $62,000, reflecting broader market selloffs.
20/11/2026
Wall Street Acquired $4.2 Billion in Bitcoin ETFs in Q3
Wall Street firms acquired $4.2 billion in Bitcoin through spot Bitcoin ETFs in Q3, with advisors becoming the largest holders, according to Bloomberg Intelligence.
19/11/2026
AI Credit Complex and Bitcoin's Potential Market Impact
The Anthropic IPO, valued at $1.6 trillion, signals significant capital flows in the AI sector, which could indirectly impact Bitcoin as investors seek new opportunities.
19/11/2026
Bitcoin à 64 000 $ : Waller suggère une hausse de taux d'
Bitcoin traded near $64,000 as Federal Reserve Governor Christopher Waller suggested a half-point rate hike, signaling a more aggressive stance on inflation.
18/11/2026
Bitcoin Dips to $64,000 as MSTR Falls Below $100
Bitcoin's price fell near $64,000 on Tuesday, influenced by declines in crypto-related stocks and broader market weakness, despite renewed institutional interest in spot Bitcoin ETFs.
18/11/2026
Bitcoin Holds Near $65,000 Amid Nasdaq Drop and Strong Dollar
Bitcoin's price held near $65,000 on Monday, defying a 2.5% drop in the Nasdaq Composite and a strong dollar, marking a shift from recent market correlations.
17/11/2026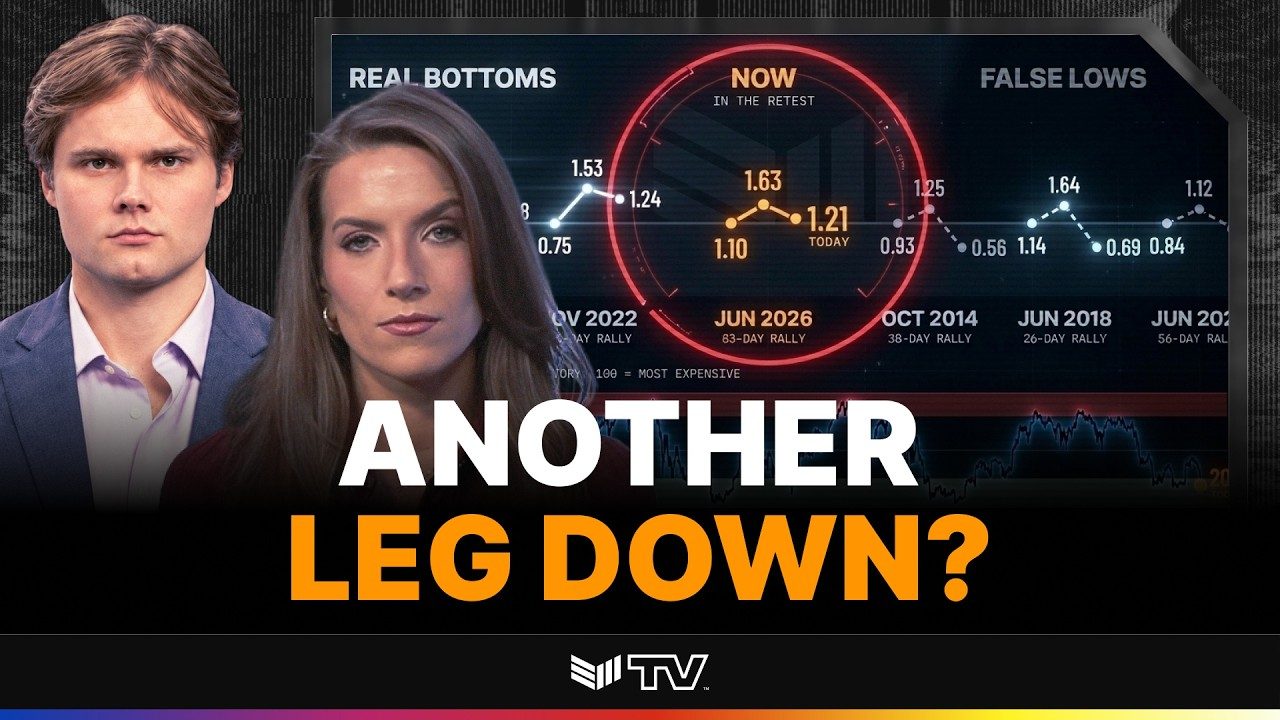
Bitcoin's MVRV Ratio Suggests $59K as Key Test for Bottom
Bitcoin's MVRV ratio suggests that $59,000 is a critical test for determining if the market has found a true bottom, following an 80% retracement of its summer rally.
17/11/2026
Bitcoin Plunges, Sentiment Hits 'Extreme Fear'
Bitcoin recently plunged to approximately $62,000, pushing the Crypto Fear and Greed Index to "Extreme Fear," a sharp decline from "Greed" a month ago.
16/11/2026
Robinhood Crypto Trading Volume Halves as Event Contracts Rise
Robinhood's crypto trading volume fell 48% year-over-year in October to $17 billion, while event contract trading more than doubled.
15/11/2026
Bitcoin Falls to $65,000 Amid Strong Dollar, ETF Outflows
Bitcoin's price fell approximately 14% in a week to $65,000, its lowest since mid-August, driven by a strong dollar, rising yields, and significant ETF outflows.
15/11/2026
Bill Miller IV Explains Why He Remains Bullish on Bitcoin
Bill Miller IV, Chairman and CIO of Miller Value Partners, explains his continued bullish stance on Bitcoin, emphasizing its scarcity and viewing volatility as a characteristic of high-performing assets.
14/11/2026
Joe Carlasare Rejects 'Extreme Fear' in Bitcoin Market
Joe Carlasare challenges the notion of 'extreme fear' in the Bitcoin market, citing rapid capital inflows as a sign of potential recovery.
14/11/2026
Is Bitcoin Higher 12 Months After a Midterm Election? It Was 3 for 3 Since 2014 — but 71% of All 365-Day Windows Rise Anyway
Bitcoin was higher 12 months after each of the 2014, 2018 and 2022 midterms (+24.5%, +44.9%, +92.3%), but 71.4% of all 365-day windows since 2014 were up, and the median midterm result sits below the median window.
04/11/2026
What Does Bitcoin Do After It Closes Below Its 100-Day Average? In 22 Crossings Since 2015 the Next Week Was Up 15 Times, but the Next Month Was Close to a Coin Flip
Bitcoin is testing its 100-day average on election day. This desk found 22 earlier first closes below the line after a run above it: the next 7 days beat the baseline, the next 30 days did not, and 2017 drives the headline average.
03/11/2026
What Does Bitcoin Do in November After a Down October? In Three Cases Since 2014 It Fell Twice by 17% or More — and After Any Down Month the Next One Averages +2.7% Versus +8.2%
Bitcoin fell about 7.3% in October 2026, breaking the “Uptober” habit. Using Yahoo Finance monthly closes since 2014, we test what followed in November after a down October (three cases) and in the month after any down month (63 cases).
02/11/2026
What Does Bitcoin Do in the 30 Days After a US Election? In Six Elections Since 2014 It Rose Four Times, Averaging +7.8% — but the Three Midterms Averaged −16.3%, and the Swings Were Twice as Wide as Normal
In six US elections since 2014, bitcoin rose in the following 30 days four times, averaging +7.8% (median +11.2%) — but the three midterms averaged −16.3%. Four of six moves were larger than 16% either way, against 38% of all 31-day windows.
01/11/2026
What Does Bitcoin Do the Month After the Nasdaq Falls 4% or More? In 19 Months Since 2014 It Rose 14 Times, Averaging +11.5% — but That Is Not Statistically Different From a Normal Month, and the 2018 and 2022 Cases Were Far Weaker
The Nasdaq Composite fell 5.3% in October 2026. In the 19 earlier months since 2014 when it fell 4% or more, bitcoin fell in the same month 16 times and then rose in the next month 14 times, averaging +11.5% — a result that could be chance.
31/10/2026
Does Bitcoin Fall After a Major Exchange Hack or Halt? In 8 Events Since 2016, It Was Down in 6 a Week Later, With a Median of −8.6% — a Small Sample, and Binance’s Day-One −4.3% Is Already Worse Than 6 of Them
Bitcoin Mastery’s own calculation across eight exchange hacks and halts since 2016: the day-one move averaged −3.0%, the seven-day move was negative in six, and the median was −8.6% — against +0.7% for an ordinary seven-day window. The sample is eight.
30/10/2026
Does Bitcoin Fall the Day After the Fed? Across 38 FOMC Meetings the Day After the Decision Averaged −0.46% — Not Distinguishable From Zero, but Worse Than Any Other Day in the Fed Window
Bitcoin is down 1.7% the morning after the Fed held rates. Across 38 FOMC meetings since 2022 the day after the decision averaged −0.46% (standard error 0.50), 19 up and 19 down: weak, but not statistically different from zero.
29/10/2026
Does Bitcoin Move on Options Expiry Friday? Across 105 Monthly Expiries Since 2018 the Average Move Was 2.26% — Against 2.20% on Any Day — and Since 2022 Expiry Days Have Been Quieter
We tested 105 last-Friday-of-the-month expiry days since 2018. The average absolute move was 2.26% versus 2.20% on all days; since 2022 expiry days were quieter, not wilder. Here is the data ahead of Friday’s $11 billion expiry.
28/10/2026
Does Bitcoin Move the Day Before the Fed? Across 38 FOMC Meetings the Day Before the Decision Averaged −0.18% — Statistically Zero, but the Range Ran From −8.3% to +9.1%
Tuesday 27 October is the first day of the Fed meeting. Across 38 FOMC meetings since 2022, bitcoin’s return on the day before the decision averaged −0.18% with a standard error of 0.44 points: no detectable pattern, but fat tails.
27/10/2026
Bitcoin’s 30-Day Range Is Only 10% — Tighter Than 97% of Days Since 2016. In the 88 Days It Was This Quiet, the Next 10 Days Averaged +6.8% — but the Typical Move Was No Smaller
Bitcoin’s 30-day high-to-low range is 10.1%, the 2.6th percentile of 3,623 windows since 2016. We tested what followed the 88 days that quiet: bigger average moves and an upside skew, but a median move no smaller than normal.
26/10/2026Is Bitcoin “Digital Gold”? On the 59 Days Gold Fell 1% or More in the Past Year, Bitcoin Averaged −1.39% — and on the 59 Days Gold Rose 1% or More, It Averaged +0.87%
Gold lost 4.1% last week and broke below $4,000. We tested the “digital gold” idea on five years of daily data: on days gold fell 1% or more, bitcoin fell with it more often than not, which is the opposite of a hedge. The sample is small and the link is weak; here is exactly what the numbers show.
25/10/2026Is Bitcoin Trading Like the Nasdaq Again? The 30-Day Correlation Has Jumped From 0.15 to 0.60 Since August — the 80th Percentile of 1,223 Windows Since 2021 — Yet the 60-Day Reading Is Only 0.35
Over the 30 trading days to 19 October, bitcoin’s daily returns correlated 0.60 with the Nasdaq Composite, up from 0.15 on 31 August and higher than in 80% of the 1,223 rolling 30-day windows since October 2021. The 60-day reading is just 0.35. We lay out the numbers, the caveats and what the history does and does not say.
21/10/2026
Does Rising Oil Hurt Bitcoin? On the 67 Days Brent Jumped 2% or More in the Past Year, Bitcoin Averaged −0.46% on the Day Versus −0.10% on All Days — a Gap Within the Noise, as Houthi Attacks on Saudi Targets Keep Brent Near $110
We matched 250 trading days of Brent crude to bitcoin from 20 October 2025 to 19 October 2026. On the 67 days Brent rose 2% or more, bitcoin averaged −0.46% the same day (median −0.61%), against −0.10% on all days. The gap is not statistically significant, and it vanishes by the next day.
20/10/2026
How Does Bitcoin Trade on Fed Decision Days? Across 38 FOMC Meetings Since January 2022 It Averaged +0.49% on the Day, Statistically Zero — and the Fed-Day Volatility Premium Has Vanished Since Mid-2024, Nine Days Before the 28 October Decision
We measured bitcoin’s move on all 38 scheduled FOMC decision days from January 2022 to 16 September 2026. The average was +0.49% (standard error 0.51), the median +0.14%, and 21 of 38 were up. The extra volatility that used to come with Fed days has gone: since June 2024 the average absolute move equals a normal day’s.
19/10/2026
After a 4% Nasdaq Drop, What Does Bitcoin Do Next? In the 55 Weeks Since 2016 When the Nasdaq Lost 3% or More, Bitcoin Fell in 39 of Them (Average −3.6%) — but the Following Week Was Up 31 Times, Barely Better Than Normal
We checked 520 weeks since 2016. In the 55 weeks when the Nasdaq Composite fell 3% or more, bitcoin fell in 39 and averaged −3.59%. The following week bitcoin rose 31 times out of 55, averaging +1.98% (median +0.83%) against +1.36% (median +0.61%) for all weeks — a gap well inside the noise.
18/10/2026
Is “Uptober” Real? Bitcoin Rose in the Second Half of October in 10 of the Past 12 Years, a Median +7.8% — but It Is Down 2.5% So Far This Year, and the Years That Started Weak Were a Coin Flip
Bitcoin has gained in 9 of the last 12 Octobers, but 2026 is down 2.5% halfway through the month. Our own calculation on Yahoo Finance and Coinbase daily closes shows the second half of October was positive in 10 of 12 years — and that years with a weak start were a coin flip.
17/10/2026
Does a Volatility Spike Hurt Bitcoin? On the 26 Days the VIX Jumped 10% or More in the Past Year, Bitcoin Averaged −2.70% — and Fell 1.85% on Wednesday’s 10.5% Jump
We tested a year of data: on the 26 US trading days the VIX rose 10% or more, bitcoin averaged −2.70% and rose on only 5. On the 28 days it fell 7% or more, bitcoin averaged +1.28%.
15/10/2026Is Bitcoin an AI-Chip Trade? On the 52 Days the Semiconductor ETF Fell 2% or More in the Past Year, Bitcoin Averaged −1.07% — but the Link Has Faded Since April, and the Kospi Shows None
South Korea’s Kospi fell 5.5% on AI worries and bitcoin rose 1.7%. Our 250-day study finds bitcoin averaged −1.07% on days the chip ETF SOXX fell 2% or more, but the link weakened sharply in the last six months and does not exist with the Kospi.
14/10/2026
Does a Stronger Dollar Hurt Bitcoin? On the 42 Days the Dollar Index Rose 0.3% or More in the Past Year, Bitcoin Averaged −1.33% — on the 40 Days It Fell That Much, +0.30%
The dollar index closed at a 12-month high on Monday. An own-data study of 250 days shows bitcoin averaged −1.33% on the 42 days the dollar rose 0.3% or more, against +0.30% on the 40 days it fell that much.
13/10/2026
Dormant Bitcoin Whale Moves $378 Million After Four Years
A Bitcoin wallet that held 4,582 BTC since March 2020, now worth $377.6 million, transferred its holdings to five new addresses.
13/10/2026
Does Falling Oil Lift Bitcoin? On the 58 Days Brent Dropped 1.5% or More in the Past Year, Bitcoin Averaged +0.02% — On the 77 Days It Jumped, Bitcoin Averaged −0.42%
Oil fell on a Russia–Ukraine ceasefire claim. Does cheaper crude help bitcoin? A year of daily data shows oil drops are close to neutral for bitcoin, while oil spikes have been a mild headwind.
12/10/2026
IMF: Tokenized Stocks Show Demand, Volatility, and Illiquidity
The IMF finds that tokenized stocks show demand for fractional ownership and 24/7 trading but face volatility and liquidity challenges.
12/10/2026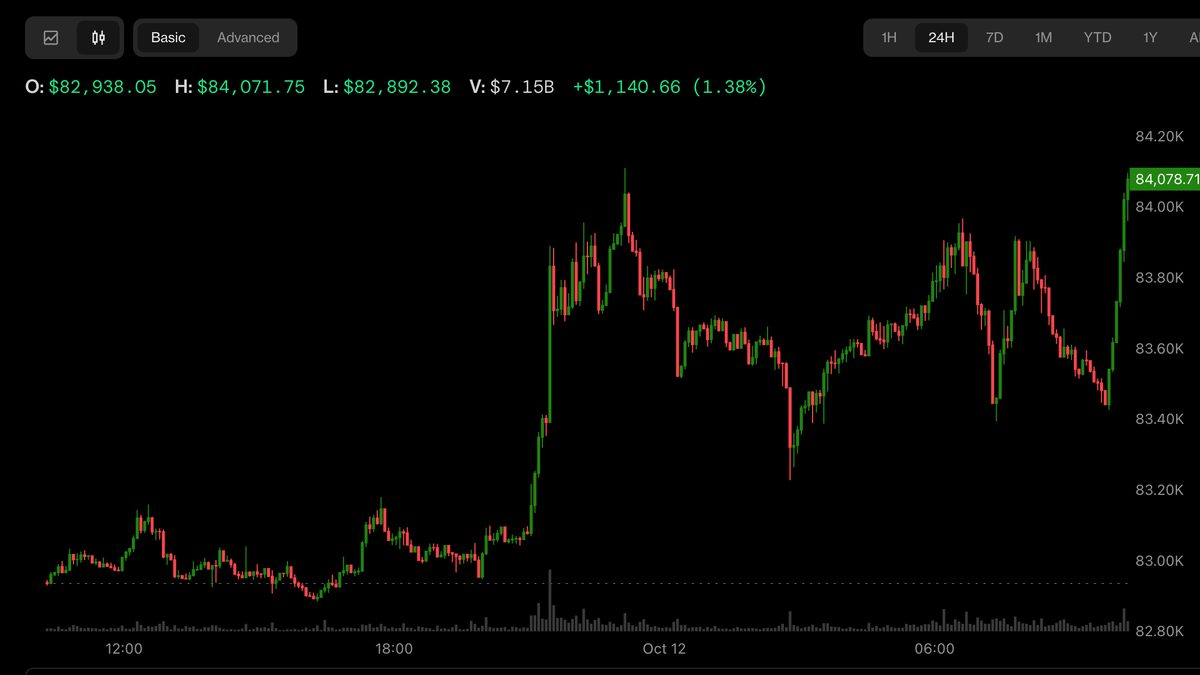
Bitcoin Nears $84,000 Despite ETF Outflows as Oil Prices Dip
Bitcoin's price rebounded to nearly $84,000 despite U.S. spot Bitcoin ETFs recording $681 million in outflows last week, their largest since June.
12/10/2026
Bitcoin Has Spent the Weekend in a 0.77% Range, but Quiet Weekends Are Normal — the Median Since July Is 1.26% — and the Five Tightest Ones Were Followed by Smaller Moves, Not Bigger, Ahead of Wednesday’s CPI
Bitcoin’s 30-hour weekend range is 0.77%, narrower than 10 of the last 14 weekends. But quiet weekends are the norm (median 1.26%), and after the five tightest ones the next 48 hours averaged a 3.0% range against 4.7% after the others.
11/10/2026
Tokenized Commodities Expand Beyond Gold to Lending, Oil
Tokenized commodities are expanding beyond gold to include lending against physical assets and the tokenization of oil and natural gas, with the market reaching $5.55 billion by March 2026.
11/10/2026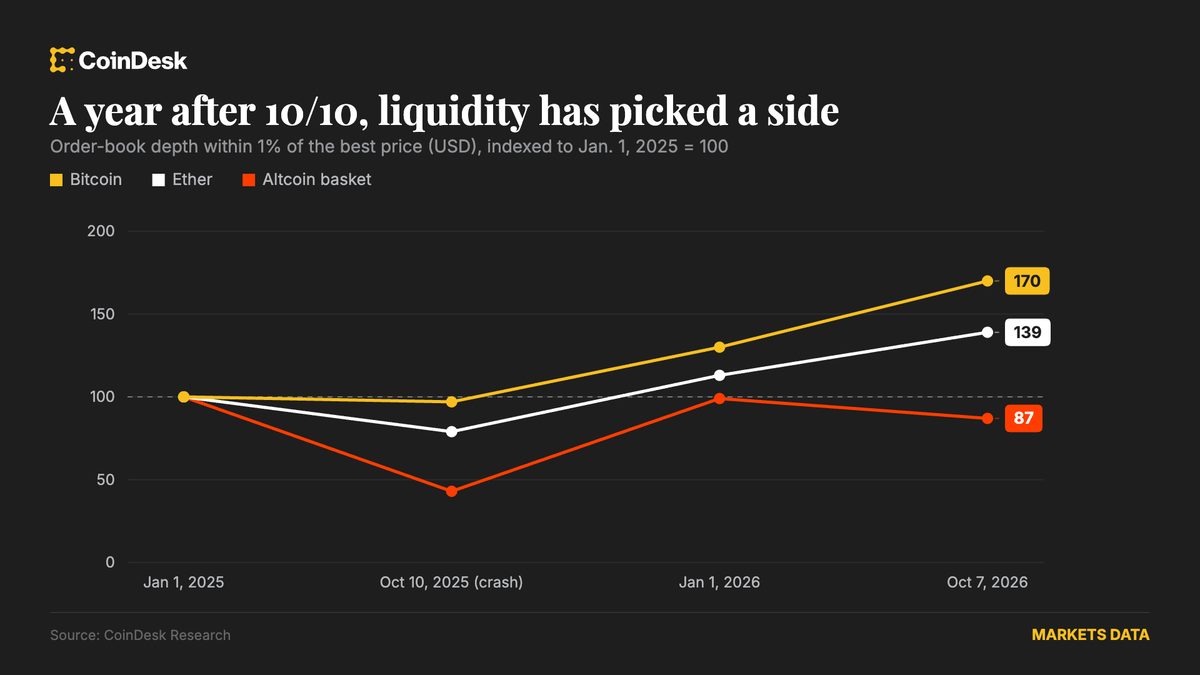
Bitcoin and Ether Liquidity Rebound, Altcoins Lag
One year after a major market event, Bitcoin and Ether have significantly rebuilt their market liquidity, while altcoin liquidity has declined.
10/10/2026
What Bitcoin Did on the Last Seven CPI Mornings: Five Rises, Two Falls, a Four-Hour Range of 2.8% Against 1.7% on an Ordinary Day — and Wednesday's Consensus Is +0.6%
Across the seven CPI releases since March 2026, bitcoin's 12:00-16:00 UTC range averaged 2.8% against 1.7% on an ordinary day, and its move in the first two hours averaged 1.3% against 0.5%. The direction, though, was up five times and down twice with no clean link to the print.
10/10/2026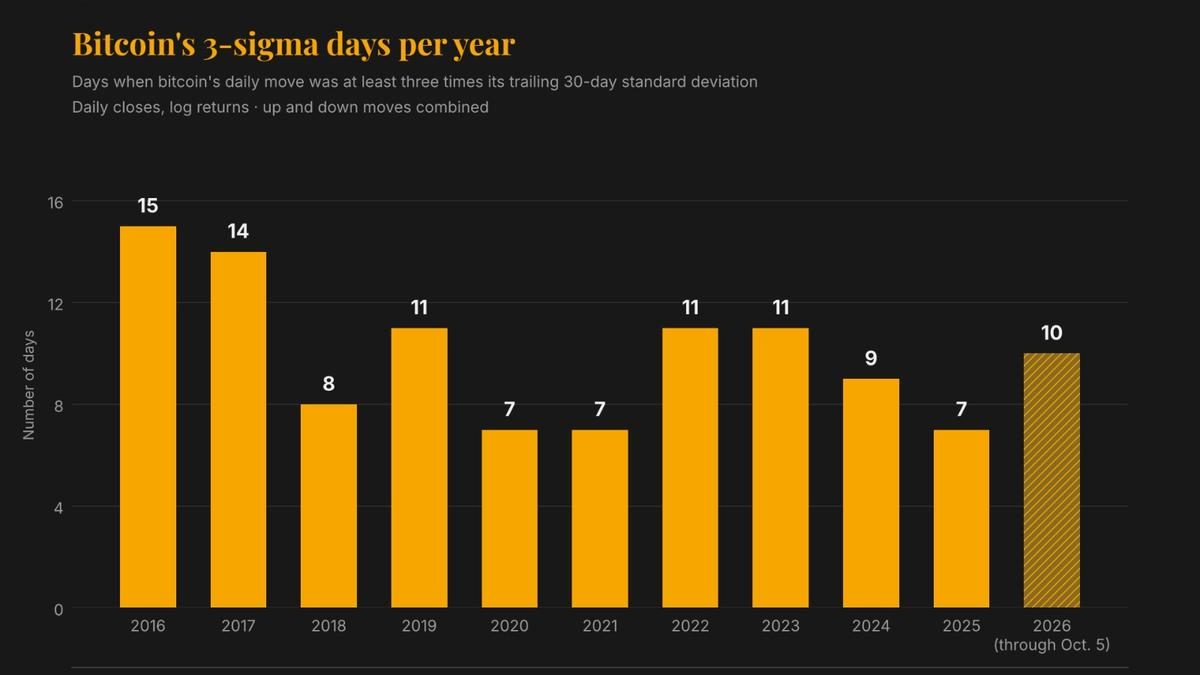
Bitcoin Volatility: Fewer Swings, More Extreme Price Days
Bitcoin's annualized volatility has dropped, but extreme price swings are more frequent in 2026 than in 2018, challenging standard risk models.
10/10/2026
Bitcoin's Role in a $300T Bond Market, Says UTXO's Asmus
Loren Asmus of UTXO Management sees the $300 trillion bond market as Bitcoin's next frontier, emphasizing its role as a structural allocation for institutions.
09/10/2026
Falling Yields Did Not Save Bitcoin on Thursday: Since September 1 the 10-Year Fell on 7 Sessions and Bitcoin Rose on 4 — but Without Two Outliers the Average Is −0.13%
On 8 October the 10-year yield fell 6 basis points and bitcoin still lost 1.90%. A session-by-session scorecard since 1 September shows falling yields are not the floor many traders assume — and what actually drove Thursday's drop.
09/10/2026
Bitcoin's Liquidity Advantage Grows With Institutional Interest
Bitcoin's portability and divisibility are increasingly distinguishing it from traditional assets as institutions enter the market, offering new liquidity options for holders.
08/10/2026
Treasury Yields Hit Their Highest Since 2002 — Bitcoin Is Still 42% Above Its June 30 Low, but on the 12 Days the 10-Year Jumped 5 Basis Points or More It Averaged −0.9%
The 10-year Treasury yield touched about 5.35% on Wednesday, which TheStreet calls the highest since 2002. Bitcoin is up 42% since 30 June regardless. A day-by-day test of 192 sessions shows why both statements are true.
08/10/2026Fed Minutes at 2 p.m. ET and a $39 Billion 10-Year Auction Today: Bitcoin Is $84,200, Rejected Three Times at $87,000 With the 10-Year Yield at 5.27%
Wall Street gets the Fed's September meeting minutes at 2 p.m. ET and a roughly $39 billion 10-year Treasury auction on the same day. Bitcoin, after three rejections at $87,000, sits $200 above the $84,000 level CoinDesk flags as the line that decides control.
07/10/2026
One Year After Bitcoin’s $126,296 Peak: Down 32%, While the Nasdaq Sets Records and the 10-Year Treasury Yield Is 113 Basis Points Higher
On 6 October 2025 bitcoin printed $126,296. A year later it trades about 32% lower while the Nasdaq sits at a record and the 10-year yield is 113 basis points higher. The numbers behind the gap — and why two sessions explain the whole September recovery.
06/10/2026
Bitmine Nears 5% Ethereum Supply Target, Citing Bull Market
Bitmine acquired an additional $41 million in Ethereum, reaching 99% of its 5% supply target, as Chairman Tom Lee declared a crypto bull market is underway.
05/10/2026
Markers Tuesday: Washington Votes at 14:15 Today and the Fed Moves at 14:00 Tomorrow — and the Leverage Signal That Flipped on Monday Flipped Straight Back, a 582 Basis-Point Round Trip in One Session; Z1 Grades a FAIL
The United States Senate votes at 14:15 Eastern today on whether to open debate on the CLARITY Act, and it needs sixty. Twenty-three hours and forty-five minutes later, at 14:00 Eastern on Wednesday, the Federal Reserve publishes a rate decision alongside a Summary of Economic Pr
15/09/2026
Markers Monday: Washington Votes Twice in 48 Hours — Senate Cloture Tuesday, Fed Wednesday — and Bitcoin Goes In With Perpetual Funding 195 Basis Points Above the September Futures Curve, a 300 Basis Point Swing in One Session; T1 Grades a Fail
Two Washington votes in 48 hours — Senate cloture on the CLARITY Act at 14:15 ET Tuesday needing 60, and the FOMC at 14:00 ET Wednesday with the range at 3.50–3.75%. Bitcoin closed Sunday at $76,808.69, down 0.596%. Perpetual funding crossed above the September basis: 7.837% against 5.885%, a 195bp gap where Sunday had 105bp the other way. Open interest rebuilt 1,597.723 coins, top-trader positioning hit a 30-day high, and Fear & Greed fell two sessions. T1 grades a fail at 3,400 against 3,500.
14/09/2026
Markers Friday: The 10-Year Closed at 4.95%, Its Highest Since October 2023, the 2-Year Jumped 13 Basis Points on a 5.4% PPI and Oil Settled at $107 — Bitcoin Fell a Fourth Day to $76,529, Its Lowest Close Since 20 August; Real Yields Passed Marker I1, the Tranche Marker U1 Needs +4.95% Today, and CPI Prints at 12:30 UTC
The 10-year Treasury closed at 4.95% on Thursday, its highest since October 2023; the 2-year rose 13 basis points to 4.56% after August producer prices came in at 5.4% year on year; WTI settled at $102.48 and Brent at $107.63; and US stocks fell for a fourth day. Bitcoin fell for a fourth day too, 2.24% to $76,528.75 on Bitstamp, its lowest close since 20 August and $3,789 a coin under Strategy’s tranche. The 10-year real yield closed at 2.55% and settled marker I1 a pass; the 30-year at 5.37% has H3 passing by 12 basis points; marker U1 needs a +4.95% close today. Leverage came back after a day at the window low, funding fell to 3.3% annualised and the September basis collapsed from 6.6% to 4.0%. CPI is at 12:30 UTC; consensus is +0.4% headline and +0.2% core, and hike odds are about 70%.
11/09/2026
Markers Thursday: The US Sank Five Iranian Tankers, Brent Settled Above $100 for the First Time Since July and the 10-Year Closed at 4.83% — Bitcoin Fell for a Third Day to $78,282, Perpetual Open Interest Printed the Low of Its Window, the ETFs Gave Back $166.8 Million in Two Sessions, and Strategy’s Marker Failed
US forces sank five Iranian tankers on Tuesday night and Iran said it hit ten ships near the Strait of Hormuz on Wednesday; Brent crude settled at about $101, its first close above $100 since July; and the 10-year Treasury closed at 4.83%, the 2-year at 4.43% and the 30-year at 5.28% on the Treasury’s own curve. Bitcoin closed Wednesday at $78,281.65 on Bitstamp, its third consecutive decline and $2,036 below the price Strategy paid for its last tranche — a tranche the company did not add to, which fails marker M1. The desk walks the nineteen open markers through two days it did not publish, with the perpetual at the low of its 31-day window, the September basis at 6.6%, two straight ETF outflow days, and producer prices due at 12:30 UTC today.
10/09/2026
Markers Monday: Bitcoin Closed Sunday at $80,339 — $21 Above Strategy’s Tranche — Through a Weekend in Which the US Struck Three Iranian Tankers and Iran Fired at a Carrier; Leverage Left for a Third Day, the September Basis Rose to 5.27%, and the Week Ahead Holds PPI, CPI, a Cloture Vote and the Fed
The United States struck three Iranian vessels on Saturday after Iran fired ballistic missiles at an American aircraft carrier and a destroyer near the Strait of Hormuz, Brent closed Friday at $96.28 — its highest since 24 July — and bitcoin’s response over the weekend was a Saturday range of $722 and a Sunday close of $80,338.98, up 0.637%, which happens to sit $20.98 above the $80,318 average Strategy paid for its 4,603 coins last week. Monday is Labor Day: no US stocks, no Treasury file, no ETF row. The desk uses the quiet to walk the fifteen open markers, print the third consecutive day of leverage leaving the Binance perpetual, note that the September basis has climbed to 5.27% while funding sits at 3.06%, and set out the four dated events that will grade seven of those markers between Thursday and the following Friday.
07/09/2026
Markers Sunday: The Retarget Settled at +1.31% and Graded D2 a Fail and F1 a Pass, Funding Printed Its First Negative Settlement in 113 Rows, 6,463 Coins of Leverage Have Now Left in Two Days, and the ETFs’ $174.6 Million Took September to +$770 Million
Two markers graded on Saturday night. The difficulty retarget at block 965,664 arrived at 20:32 UTC at +1.3065%, per mempool.space, taking difficulty to 127.45 trillion: D2, which needed a reading between −1.50% and 0.00%, failed; F1, which needed anything at or above zero, passed. The last 89 blocks of the period averaged 9.65 minutes, faster than the 9.88-minute period pace, which is why the realised figure came in above Saturday morning’s +1.20% projection. On Binance, perpetual open interest fell another 1,657 coins to 106,255 at 00:00 UTC — 6,463 coins, or 5.73%, below Thursday’s peak — and the 08:00 UTC Saturday funding settlement printed −0.000150%, the first negative print in the 113-settlement window we hold from 30 July. Farside filled Friday’s ETF row at $174.6 million, all of it IBIT and FBTC, taking the week to $986.7 million and September to +$770.0 million after four sessions. Bitcoin closed Saturday at $79,830.42, up 0.193%, in the tenth-narrowest range of the year. Fifteen markers are open after today’s three new ones; none other than D2 and F1 graded.
06/09/2026
Markers Saturday: J1 Failed on a 3bp Close, the 5,065 Coins of Leverage That Arrived Thursday Left on Friday (−4,805), Funding Fell to 1.1% Annualised, H3 Slipped 1bp Below Its Bar — and the Retarget Grades D2 and F1 Tonight at About +1.20%
One marker failed on Friday. J1 — the 2-year Treasury moving at least 5bp on the payrolls close — graded on a +3bp close at 4.37%, on the day the print beat the consensus by 109,000. The leverage story reversed in a single snapshot: Binance perpetual open interest, which had added 5,065.48 coins into Friday’s 00:00 UTC row, lost 4,805.01 into Saturday’s (−4.263%), the largest one-day decline of the twelve daily snapshots we hold, with the coin/dollar identity closing at 0.93830; funding at the 00:00 settlement fell to 0.001014% per eight hours, 1.110% annualised, the lowest since 16 August; the September basis held at 2.875%; retail accounts flipped back to net long and the largest positions to their most long of six rows. H3 is failing by 1bp after the 30-year closed at 5.24%. The difficulty projection is +1.200% with 90 blocks to go and the retarget expected around 21:00 UTC tonight, which fails D2 and passes F1 unless the last 90 blocks average more than twelve minutes. The Farside row for Friday was blank at our pull. Fifteen markers on the board: three settled (two passes, one fail), two grading tonight, ten open.
05/09/2026
Markers Friday: H1 Settled at $81,265 and I3 Settled at a 2.85% Basis, the ETFs’ $730.8 Million Was the Largest of 14 Sessions and Flipped September Positive, and 5,065 Coins of Perpetual Leverage Arrived Overnight
Two markers settled on Thursday and both passed. H1 — a Bitstamp close at or above Strategy’s $80,318 tranche price by 30 September — settled at $81,265.00, a 1.179% margin, 27 days early. I3 — a September quarterly basis below 4.00% annualised at a 06:00 UTC snapshot before 25 September — settled at 2.849%, down from 4.306% in one day. H2, September’s ETF total, flipped from −$135.4 million to +$595.4 million on a $730.8 million session, the largest of the fourteen on Farside’s table. Meanwhile Binance perpetual open interest added 5,065 coins overnight (+4.705%), the largest one-day addition in our ten snapshots, with the coin/dollar identity closing at 1.10031; funding printed 9.371% annualised; retail accounts flipped net short; the difficulty projection jumped to +1.468% with the retarget pulled forward to Saturday evening; and Fear & Greed rose nine points to 74. Twelve markers, two settled, ten open, one grading tonight.
04/09/2026Markers Thursday: The ETFs Took Back $101 Million of Tuesday’s Outflow, GBTC Posted Its Largest Redemption in 13 Sessions, and the Difficulty Projection Has Fallen 1.18 Points in 48 Hours
Nothing settled on Thursday and nothing was supposed to. Ten markers are open, and this is the daily grading: September ETF flows at −$135.4 million after two sessions (H2), bitcoin 3.383% below Strategy’s $80,318 entry (H1), the 30-year at 5.27% (H3, passing), the 10-year real yield at 2.45% and five basis points from I1, September basis at 4.306% and 31 basis points from I3, perpetual open interest 7.65% above G1’s bar, and a difficulty projection that has gone from +1.415% to +0.796% to +0.234% in three mornings and now settles early Sunday. All figures own-pulled at 06:10 UTC, 3 September 2026.
03/09/2026
Markers Wednesday: September's First ETF Session Was a $236.5m Outflow — and the First Session Has Called the Month's Sign Exactly 16 Times in 32
September's first spot bitcoin ETF session was a $236.5 million net outflow, the largest since 31 July, with IBIT's $201.2 million its largest since 24 July. We scored all 32 complete months of Farside data: the first session's sign has matched the month's sign 16 times. Also on the board: H1 now needs +3.43%, the difficulty projection gave back 0.62 points, the September basis fell 117bp to 4.29% annualised, and the crowd flipped net long into the first red day.
02/09/2026
Markers Tuesday: August Was the First Positive August in the Bitcoin ETFs’ History — and Both Septembers on Record Were Green
Three markers settled overnight on final August data and all three passed. The ETF marker cleared its bar by $114.2 million, and pulling the full 32-month Farside history to grade it turned up something nobody printed on Monday: the US spot bitcoin ETFs have now seen three Augusts, and this is the only one that was positive. August 2024 lost $92.2 million, August 2025 lost $749.2 million, August 2026 took in $3,539.1 million. The same table also contains both Septembers on record, and both were green — which is awkward for the seasonality argument this desk itself ran on Sunday. Plus: BlackRock supplied 87.30% of the entire month, and the difficulty projection swung another 1.09 points overnight.
01/09/2026
Markers Monday: Bitcoin’s $1.44bn of New Open Interest in August Was Entirely Revaluation — the Coin Count Fell 2,196 — and We Were Wrong About the Greed Record
Binance perpetual open interest rose $1.44 billion in dollar terms across August and fell 2,196 coins in coin terms; the two changes multiply out exactly. The September basis annualises at 5.349% against a 3.90% three-month bill. Three markers settle on tonight’s prints. And Sunday’s “longest greed streak” figure was an artifact of how deep we pulled — the current run ranks 23rd of 98, not second.
31/08/2026Markers Saturday: The Leverage That ‘Arrived’ on Friday Left on Saturday and Netted 15.55 Bitcoin — and B2 Went From Passing to Failing in One Session
We wrote on Friday that there was positioning to unwind. There was, and it unwound - but on the hawkish outcome we had named as the less dangerous one. Full grading of X2, Y1 and B2, the crowd's 29.08% one-day flip into net long on a 5.6% drawdown, and a table of everything we got wrong this week.
29/08/2026
Markers Friday: C1 Passes the Bar We Called Badly Designed — and Z2 Fails on a Bar That Was the Series Maximum All Along
Four markers expired. C1 passed by 1.62% nine hours after we called its bar badly designed; C2 passed at 2.0712; Z3 settled at +$1,126.4m. Z2 failed : and its bar, 111,988, turns out to be the exact maximum of the 31-row open-interest series it was testing. Plus the largest one-day OI build in the retained series, funding positive in 90 of 90 while still 0-of-500 above baseline, and an ETF session that was IBIT-only.
28/08/2026
Markers Thursday: A3 Fails by a Tenth of a Point — and Our Most-Quoted Fact About This Rally Turns Out Not to Be About This Rally
A3 fails: July core PCE printed 3.3% against a 3.2% bar - on an annual rate that has not moved since June. And the funding claim this column has led on for four runs turns out to cover 500 settlements back to 13 March, not the 24 we published: true, far bigger, and for that reason not evidence about August at all. Plus C3's projection moving 0.208pp in fifteen minutes, both cohorts reversing off 30-day extremes, and open interest falling for a second day.
27/08/2026
Markers Wednesday: the Size Money Bought the Rejection, the Crowd Went Exactly Flat — and the Gap Between Them Is the Widest in 30 Days
Nine live markers graded on the morning July core PCE settles A3. Binance's top-trader position ratio hit 2.2560, a 30-day high, on the candle that rejected $81,272 - while the retail crowd went to 50.02% long, 49.98% short. The spread between the two cohorts, 2.254x, is also a 30-day high. Funding has now failed 24 straight settlements, and we revise B2's odds upward and A3's downward.
26/08/2026
Markers Tuesday: A1 Passes, the Crowd Goes Net Short Into a Three-Month High, and the Funding Pin Breaks Downwards
Two positioning series flipped on the candle that took bitcoin to $81,272.62, and both flips argue against the story the coverage is telling. The crowd’s account ratio went below 1.00 — net short at a three-month high — while the size accounts trimmed a series high for the first time in six days. Coin open interest is building at last, up 1.60%, and still 4.26% below where it was before the rally. Plus A1 graded, three new markers, and X2 and Y1 failing against our own premise.
25/08/2026
Markers Monday: Z1 Passes on a Settled Close, Z2 Hits a Series Low — and Funding Has Now Spent Eight Straight Settlements Pinned to the Floor
Z1 passes on a settled weekly close of $77,734.00 — and we grade the marker’s design as well as its outcome. Z2, our own falsification marker, hits a series low at 105,531 BTC while dollar open interest reads +16%. Sixteen consecutive funding settlements at or below the 0.0100% baseline, the last eight exactly at it. The top-trader position ratio hits 2.0859, a series high, for a fifth straight day. Plus three new markers, including one that settles today.
24/08/2026
Markers Sunday: U2 Fails at −1.312%, and the Largest Accounts on Binance Just Crossed 2:1 Long — Into the Drawdown
Bitcoin’s difficulty retargeted at −1.312% this morning and our U2 marker failed. The seven-snapshot post-mortem shows the projection had the wrong sign for two consecutive days at mid-epoch. Meanwhile Binance’s top-trader position ratio hit 2.0533, a series high, rising through a 4% drawdown while the retail account ratio sat flat at 1.0072.
23/08/2026
Markers Saturday: Y2 Passes on Both Legs — and Open Interest Fell Again While Bitcoin Added $9,000
Bitcoin added 22.8% this week. Binance coin-denominated open interest fell 5.7% over the same stretch. Funding never once exceeded the venue baseline. And the retail crowd that entered the week 2.2-to-1 long finished it flat while the largest accounts went 1.96-to-1 long. Six data series, one marker graded, one of our own falsification markers moving further out of reach.
22/08/2026Markers Friday: W1 Passes on Selig’s Ultimatum, U1 Expires Empty — and a 20% Rally the Derivatives Market Didn’t Fund
Three markers close, one settles Saturday night. W1 passes on the CFTC chairman's threat to write a crypto rulebook without Congress; U1 fails on a filing that showed an issuance and no coin sale; X3 passes four times over. And the find: open interest is 2.3% below its pre-rally level after a 19.68% week.
21/08/2026
Markers Thursday: Three Passes in One Tape, the Minutes, the $65K Close, the $40T Debt, and the Difficulty Projection Flips Again
X1 passed on "several participants" favoring a hike, U3 passed nine days early on a $69,334.79 close, Y3 passed on the $40 trillion debt print : and the difficulty projection flipped sign for the second time in five days.
20/08/2026
Markers Wednesday: X3 Passed on Both Legs, and the Bond Market Handed Us a Cleaner Divergence Test
X3 asked for one positive ETF session out of two. It got $297.5 million and $189.3 million. U2 held its sign for a second day at +0.37%. U3 came within 0.42% of its bar and missed on the close. X1 cannot be graded until 2:00 p.m. ET today and we are not going to pretend otherwise. And the global long-bond rout gives us a divergence question sharp enough to write a two-legged marker around it.
19/08/2026
Markers Tuesday: the Difficulty Projection Flipped Sign, and R3 Was Right Three Days Late
Three consecutive daily snapshots of the same endpoint at the same hour: −1.63%, −0.28%, +0.49%. The projected difficulty retarget has crossed zero, and marker U2 is now pointing at a pass. Meanwhile R3 — our oil marker, graded FAIL on August 14 with Brent at $88.52 — watched Brent settle at $90.87 on August 17. Right thesis, wrong deadline, and that distinction deserves its own grading category. Plus U1 turns on a filing that showed no coin sale at all, and three new markers go on the board.
18/08/2026
Markers Monday: T1 Fails at $62,900, and the Hashrate Refuses to Agree With the Price
T1 fails: the weekly candle closed at $62,900 against a $63,220 bar, the lowest weekly close in seven weeks, and it failed on both of our price sources — a clean grade. But the more interesting number this morning is not the price. In 24 hours the projected difficulty retarget moved from −1.63% to −0.28%, and mempool.space’s daily hashrate estimate printed above one zettahash for the first time on our board. Miners are not behaving like people who think this is a bear market. Three new date-anchored markers go on the board.
17/08/2026
Markers Sunday: The $63,220 Close Decides Tonight, Whales Split the Tape, and the Difficulty Clock Turns Negative
The Friday flow print we owed you settles at −$56–58 million — a third straight red day, closing a −$389.7 million week, the worst in six weeks. On-chain, the 10,000-BTC cohort is at a six-month high while a $125 million short leans against it: someone is wrong, and tonight’s weekly close against $63,220 is the first scheduled arbiter. Plus: the next difficulty retarget is projecting negative for the first time in our board’s coverage, and three new T-series markers get written down before the events.
16/08/2026
Markers Saturday: The Vote That Never Happened, Q2 Dies at $62,900, and a $300 Million Outflow Week — Grades and New Commitments
Our marker board assumed the SEC would vote Friday. It did not — so S1 and S2 grade VOID, and we replace them with markers that can actually settle. Q2 needed a $65,000 close and got $62,900: FAIL. Retail sales fell 0.6% against a +0.1% consensus — the biggest drop since May 2025 — and bitcoin was the one risk asset that did not care. Full grades, the flow ledger, and three new commitments.
15/08/2026
Markers Friday: Oil Stopped Two Dollars Short, the Flow Test Failed, and Q2 Dies Tonight, Grading a Week of Pre-Commitments
14/08/2026
Markers Thursday: The 0.2% That Killed R1, a Failed Flow Test — and Oil Two Dollars From Rewriting the Week
Grading day. R1 — our two-legged CPI/rates marker — died on Wednesday’s 0.2% core print before its second leg ever came up. R2, the ETF flow test, closes at roughly −$38M against a +$400M bar: FAIL, and an honest accounting of what that does (and does not do) to the hidden-seller thesis. R3 is the live one: Brent at $88 against a $90 trigger, with a presidential “total control” claim and an IEA deficit behind it. Full scoreboard before Friday’s public grades.
13/08/2026
The Anchor-Tenant Divide: Anthropic’s $9.1 Billion Riot Deal Is Official — and It Splits Bitcoin Mining Into Two Sectors
What Bloomberg reported Monday, both companies confirmed Tuesday: Anthropic signed a 20-year, $9.1 billion lease for 191 MW at Riot’s Rockdale campus, with options taking it to $16.1 billion. RIOT jumped 17–20% on a day bitcoin fell. The sector now divides cleanly into miners with anchor tenants and miners without — and the gap between those two groups is becoming the defining trade of August 2026.
12/08/2026
Markers Tuesday: Strategy's Fourth Sale in Four Weeks Is Now Policy, Q1 Graded, Riot Redeemed, and a $298M Flow Sprint Before CPI
Strategy's Aug 10 8-K confirmed a fourth consecutive weekly bitcoin sale, 1,690 BTC at $64,262, making STRC-defense sales policy. We grade Q1, Q2 and Q3, update R2's flow math, and set the CPI asymmetry, as of August 11, 2026.
11/08/2026
Markers Monday: BIP-110's Quiet Test Graded (With a Correction), H1 Closes, and Strategy's 8-K Sets Up the Fourth-Week Question
M3 passes 3-for-3 on the main chain, but we log a scope error: a minority BIP-110 branch did mint two blocks before freezing. H1 closes NOT FIRED, Q1 arms for Strategy's 8-K after a 1,030 BTC transfer and a cryptic Saylor post, and R2 needs $298M of ETF inflows in two days.
10/08/2026
CPI Wednesday Decides September: Three Markers We Commit to Before the Number Prints
Wednesday's July CPI is the deciding input for the Fed's September meeting after the jobs shock flipped odds toward a pause. We pre-commit three falsifiable markers for the week, CPI and hike odds, ETF flows, and Brent, grade the BIP-110 checklist on day-one data, and correct our own difficulty-retarget date in public.
09/08/2026
The Hike Bet Died and Bitcoin Barely Moved: Grading K1, K2, N1, N2, L1, L2 and M2 After the Payrolls Shock
Seven markers came due on jobs-week Friday. K1 failed as hike odds collapsed, K2 passed on MSTR's $100 reclaim, N2 confirmed the stocks-vs-Bitcoin gap, L1 closed with the Coldcard coins still parked : and a new R-series is armed for CPI week.
08/08/2026
Jobs Day Arrives With the ETF Bid Confirmed and the Fed Priced for a Hike: The Week’s Markers Face Their Finals
The ETF-absorption marker settled early and passed: $455.5M over two days against a $300M bar, the same week Strategy disclosed selling coins. Fed futures now price a 74.5% chance of a September hike before a single payroll is printed, MSTR closed below its $98 band at $96.85, and the 8:30 a.m. jobs report grades four more markers at once. The full scorecard, and the three ways today resolves.
07/08/2026
Strategy Sold 1,638 Bitcoin at a 15% Loss to Its Basis, The Treasury Model Runs in Reverse: Markers Graded
An August 3 8-K shows Strategy sold 1,638 BTC at an average $63,957-15% below its $75,419 basis, to fund preferred dividends and STRC buybacks. The marginal buyer switched sides of the book the same week ETFs absorbed $381.6M. Full marker grading: N1 at 70.5% of its bar, K2 holding through the sale, and three new Q-series markers.
06/08/2026
The $170 Million Answer: ETF Inflows Return, K3 Fails, L3 Fires, Marker Analysis, August 5, 2026
Farside's Aug 3 cell settled at +$170.1M : real inflows, rare breadth, but short of the +$265.4M bar. K3 fails, L3 fires on IBIT's $111.4M day, and the N-series now tests whether the dovish turn found buyers.
05/08/2026
Two Markers Fire in One Session: Fed Odds Crash 25 Points to 55.9%, Brent Breaks $85, Markers Graded
O1 and O3 fired the day they were set: September hike odds collapsed from ~81% to 55.9% and Brent settled at $83.82, the largest one-day dovish repricing of the cycle, on zero data. Yet Bitcoin bought just 1%. Full grading of the K, L and H series, and three new M-series markers through CPI.
04/08/2026
Ether Funds Out-Draw Bitcoin ETFs a Fourth Straight Week: F3 and G3 Fire as the War Premium Drains, Markers Graded
Grading day: J2 formally settled FAILED, the ETH-over-BTC rotation markers F3 and G3 both fire on a fourth straight winning week ($365M vs $172M in July), K2 holds with MSTR at $93.97, and the Coldcard coins stay 100% unspent. New O-series markers put numbers on the oil de-escalation.
03/08/2026
Bitcoin's Worst Month Begins: Four Straight Red Augusts, and Whales Just Bet $2.6 Billion Against a Fifth
August is bitcoin's only negative-median month, red four years running with an average −10% loss. Yet whales accumulated 40,100 BTC in nine days heading in. Both cases, the $64.5K trigger zone, and our full marker scoreboard : graded August 2, 2026.
02/08/2026
Bitcoin's Best Month in a Year Ended With Money Walking Out the Door : Straight Into Amazon
BTC closed July +7.5%, its best month in a year, then fell 2.9% on the final day while Amazon surged 15.6%. We trace the ETF-to-AI rotation, grade six open markers (J1 fired hawkish, J2 and J3 failed), and set the L series.
01/08/2026
Watch the Barrel, Not the Spreadsheet: Cool PCE Lost to Hot Oil, Grading a Heavy Week of Markers
June core PCE printed 0.1% and September hike odds rose to ~81% anyway. W3 and J1 scored the data; the market traded the oil. Plus: H2 inverted as Strategy became a seller, the ETF streak snapped, and three new K-series markers for August.
31/07/2026
The Hold Fired, the Bid Never Came: Grading Our Fed-Day Markers as September Becomes the Whole Game
Our pre-FOMC markers, graded in print: the $63K hold-scenario close fired, the pre-decision IBIT bid failed for good, and the hike tail migrated to September at 71.9%. What a 9-3 vote, a four-session ETF outflow cluster, and today's PCE print mean for Bitcoin.
30/07/2026
No Bid Into the Decision: Grading Bitcoin's Flow Markers as the Fed Weighs a 35.8%-Priced Hike
Settled Farside cells show −$476.8M over three sessions into the Fed decision. We grade markers F1 and G2 against the data, map three 2:00pm scenarios for the thinnest books since October 2024, and set markers I1, I3.
29/07/2026Five Weeks, Zero Bitcoin: Strategy's Latest 8-K Shows a Company Stockpiling Dollars Instead
Strategy's July 27 8-K confirms a fifth straight week without a Bitcoin purchase, its longest drought in two years, while it sold $544M of MSTR stock, bought back $25M of STRC preferred and grew its dollar reserve to $3.75 billion. What Michael Saylor's 'another color' tease and the new cash-first posture mean for the market's missing bid.
28/07/2026
The Marginal Buyer Took the Week Off: Strategy, IBIT and the Empty Bid Into a Fed Decision
Strategy has gone roughly a month without adding bitcoin. BlackRock's IBIT just posted its largest single-day outflow since launch. The two biggest structural buyers of the last two years both stepped back in the same week the Fed sits down. An analysis of who is left to bid.
27/07/2026
Bitcoin's Quietest ETF Week Since 2024 Meets Its Loudest Fed Meeting : What the Missing $8 Billion Is Saying
US spot Bitcoin ETFs just printed their thinnest full trading week since October 2024 : $8.05 billion, while $465 million walked out the door in two days and markets priced a roughly one-in-three Fed hike. An analysis of what conviction withdrawal means going into July 29, 2026.
26/07/2026A Tanker Attack Just Repriced the Fed More Than a Month of CPI Data: Bitcoin's Playbook for Wednesday's 64/36 FOMC
On Monday, markets gave a July rate hike roughly one chance in ten. By Friday, after Houthi strikes sent Brent above $100, the odds were 36%. We map the three scenarios for Wednesday's decision, grade our open W-series markers, and explain why the risk isn't the rate. It's the tone, delivered one day before the next inflation print.
25/07/2026
The Warsh Fed Meets Tuesday With Inflation at a Three-Year High. Here's Bitcoin's Playbook for a Hawkish Hold
Markets price an 89% chance the Fed holds at 3.50% : 3.75% next week, but with core PCE at 3.4% and the next inflation print landing the day AFTER the decision, the risk isn't the rate. It's the tone. We map three scenarios for Bitcoin, grade last week's markers, and set five new ones.
24/07/2026AMD Just Wrote Anthropic a $5 Billion Check. The Real Story for Bitcoin Is the 2 Gigawatts Behind It
Wednesday's AMD : Anthropic deal is a $5 billion headline about AI chips. Underneath, it's a story about electricity, and the bidding war for the exact megawatts that secure Bitcoin. The miners have noticed. The hashrate shows it.
23/07/2026Saylor Posted 'What's Next?' : Strategy's $3 Billion Question Hangs Over Today's 8-K
Michael Saylor's 'What's next?' tease lands on Strategy's most consequential Monday of the summer: today's 8-K reveals whether the 3-week buying pause ends, extends, or turns into more selling. Plus: grading last week's five markers.
20/07/2026
The Week Flipped Positive After All: Four Straight Days of Bitcoin ETF Inflows Total $500M, So Why Is the Price Still Stuck at $64K?
Friday's settled Farside data showed +$132.3M into spot Bitcoin ETFs : a fourth straight inflow day that flipped the week positive (+$75.5M) and fired our M1 marker. The four-day run totals +$500.2M, clearing Thursday's failed threshold one day late. Two of five markers have now fired bullish. The price, at ~$64,100, hasn't noticed. Here's the honest scorecard.
19/07/2026
The $500M Test Failed: What Three Shrinking Days of ETF Inflows Say About Bitcoin's Missing Buyers
We set a +$500M three-day ETF flow test on Tuesday. It failed at +$367.9M : with each day smaller than the last. The honest scoreboard on all five markers, why 'institutional demand' is really two opposing forces (timid flow money vs. Citadel's $400M infrastructure bet), and five new falsifiable markers for the week of July 20.
18/07/2026The Fed Won the Data War. The Strait of Hormuz Could Take the Win Back.
Three soft June prints (CPI −0.4%, PPI −0.3%, retail +0.2%) locked a July Fed hold : but a functionally shut Strait of Hormuz is writing August's inflation data right now. The transmission map, our marker scorecard, and the September scenarios.
17/07/2026
We Said, It Did: Grading the June Inflation Scorecard, and Why the Fed Hold Is Now Locked
A marker-by-marker grading of the falsifiable calls we made before June CPI and PPI: the hike scare stayed dead, the $65,581 breakout failed, ETF flows are tentatively returning, and oil plus the June dot plot keep the forward risk alive into PCE and the July 28-29 FOMC.
16/07/2026The Hike Scare Lasted 30 Hours. The Inflation Problem Didn't. What June's CPI Really Changed for Bitcoin
July hike odds went 50% → 9% on one data release, and Bitcoin rallied to $66K. But June's CPI measured pre-blockade oil, core PPI is expected to accelerate today, and the ETF complex sold −$424.7M the day before the print. A post-mortem of the fastest macro whiplash of the ETF era : including our own scorecard.
15/07/2026Trump's Hormuz Blockade Sent Oil to $80 : and Handed Bitcoin Its First Fed Hike Scare of the ETF Era
A 19% oil shock from the Strait of Hormuz blockade has lifted July Fed rate-hike odds to 50% : the first genuine tightening scare since spot ETFs became Bitcoin's marginal buyer. We trace the transmission chain, steel-man the counterargument, and set falsifiable markers.
14/07/2026Bitcoin Is Exactly 50% Below Its All-Time High. The Drawdown Is Normal : the Mechanism Isn't
At $62,779 against a $126,080 record, bitcoin has halved. Every previous bear market went deeper than −75%. But every previous bear market was made by forced sellers who no longer exist. The ETF may have traded drawdown depth for drawdown duration : and there are four observable tests that settle it.
13/07/2026Bitcoin's Production-Cost Floor Broke : And It Was Never a Floor to Begin With
JPMorgan says bitcoin trades roughly 19% below miner production cost. Hashprice sits at a record-low $29/PH/s/day. The 'cost is a floor' heuristic has failed : because production cost is an output of price, not an input to it. What actually binds, and what would falsify the bottom call.
12/07/2026The July Rally Isn't American: Bitcoin's Coinbase Premium Has Been Negative for a Record 50 Days
Bitcoin is up 10% in July and ETF inflows are back. Yet the Coinbase Premium has been negative for 50 straight trading days since May 19 : the longest streak on record. Both facts are true. Here is what their coexistence actually means for the rally.
11/07/2026Forget the ETF Flows: June CPI on July 14 Is the Number That Decides Bitcoin's Next Move
Bitcoin's July rebound is riding ETF inflows, but those flows are downstream of interest rates. This analysis explains why June CPI on July 14, not the flow tracker, is the number that sets bitcoin's direction into the July 28-29 Fed meeting.
10/07/2026
The IBIT Flip Is Here: $451 Million in Three Days, Does Bitcoin's ETF Inflow Cluster Pass the Reversal Test?
BlackRock's IBIT just posted its first three-day inflow run since mid-June, roughly $451 million through July 8, 2026. We run the flow data through the reversal-test checklist: streak, breadth, and the IBIT flip itself.
09/07/2026The $1 Trillion Question: Why Bitcoin's Next Parabolic Run Faces Its Highest Capital Bar Ever
CryptoQuant's Ki Young Ju says bitcoin's next parabolic run needs over $1 trillion in fresh capital : while 2026 ETF flows run backwards and Citi forecasts zero inflows. We test the capital-efficiency math against a supply squeeze at six-year lows.
06/07/2026The End of 'Never Sell': What Strategy's $1.25B Bitcoin Monetization Program Really Means for the Market
Strategy's June 29, 2026 Digital Credit Capital Framework authorizes up to $1.25B in bitcoin sales, $2B in buybacks and a 12% STRC dividend : ending the 'never sell' era. We analyze what a monetization-capable Strategy means for bitcoin's corporate bid.
05/07/2026
FBTC In, IBIT Out: What Bitcoin ETFs' First Inflow Day in Two Weeks Really Signals
Bitcoin ETFs took in $221.7M on July 2, 2026 : but FBTC absorbed three-quarters of it while IBIT kept bleeding. What the issuer-level divergence says about who is buying Bitcoin now, and the four conditions that would confirm a real flow turn.
04/07/2026Zero Cuts, Maybe a Hike: How the Warsh Fed Rewired Bitcoin's Second Half of 2026
The Warsh Fed's June meeting erased Bitcoin's rate-cut tailwind and floated the risk of a hike. We analyze what a 'zero cuts, maybe a hike' regime means for BTC through the rest of 2026.
03/07/2026Cyclical or Structural? Decoding Bitcoin's Record $4.5 Billion ETF Bleed
US spot Bitcoin ETFs shed a record $4.5B in June 2026. Is the institutional bid breaking, or is this a cyclical flush? We weigh the flow mechanics, the composition of redemptions, and the macro regime.
02/07/2026
Why the Fed, Not the ETFs, Is Driving Bitcoin's 2026 Drawdown
Bitcoin's 2026 slide is usually blamed on record ETF outflows. But the ETFs are the messenger. The real driver is a hawkish Warsh Fed, sticky 3.6% PCE and rising real yields : here's the case.
01/07/2026
Why Bank of America Greenlighting Spot Bitcoin ETFs to 15,000 Advisors Matters More Than $1B in Daily Flows
Bank of America cleared 15,000 advisors to recommend spot Bitcoin ETFs at 1-4% allocations. We break down why the distribution channel matters more than headline ETF flow numbers for the 2026 cycle.
29/05/2026Why Ethereum and Altcoins Keep Lagging Bitcoin in May 2026 : A JPMorgan-Era Reality Check
ETH is parked at $2,073 and defending the $2,100 line while BTC dominance grinds higher. A close look at the structural reasons altcoins are lagging : and what would have to change for the rotation to start.
28/05/2026
The Ethereum Foundation Brain Drain: What Eight Senior Departures Mean for ETH
At least eight senior researchers and leaders have left the Ethereum Foundation in 2026. We separate the structural cause, a 2025 restructuring mandate, from the noise, and weigh the bull and bear cases for ETH.
2026-05-24ETH/BTC at a 2026 Low: Why Bitcoin Keeps Winning the Two-Horse Race
The ETH/BTC ratio just touched a 2026 low near 0.027. We unpack why Bitcoin keeps outpacing Ethereum, and what would need to shift for the trend to turn.
2026-05-23
The CLARITY Act Heads Into Recess: What the Senate Did, and What Happens Next
Congress breaks for Memorial Day with the CLARITY Act parked one step short of a floor vote. We analyze what the 15-9 committee vote secured, the hurdles still ahead, and why Citi ties a $143,000 Bitcoin target to passage.
2026-05-21
Bitcoin ETFs at $123 Billion: Why Institutional Flows Are the New Price Floor
US spot Bitcoin ETFs now hold $123.5 billion in assets under management, with BlackRock's IBIT alone at $54 billion. The structural demand sink created by these products is reshaping how Bitcoin price cycles work, replacing the halving as the dominant marginal-buyer story.
19/05/2026Bitcoin at $78K: Why Tom Lee's $85K Target Still Has Three Catalysts
Bitcoin's consolidation around $78,000 has shaken sentiment, but three structural catalysts still support Fundstrat's $85,000 target into Q3 2026: relentless ETF inflows, a Fear & Greed reading near capitulation, and the CLARITY Act tailwind.
2026-05-17Why Bitcoin Miners Are Abandoning Mining: The AI Pivot Explained
Hashprice has collapsed to a five-year low, mining a single Bitcoin now costs nearly $50,000, and the largest public miners, Marathon, Riot, Core Scientific, are converting megawatts of mining capacity into AI hosting at the fastest pace in the industry's history.
2026-05-16Is Bitcoin's Four-Year Cycle Broken? ETF Flows vs. Halving Math in 2026
Bitcoin's classic four-year halving cycle is being challenged by ETF flows that now move more capital in a month than miners produce in a year. We compare the bull and bear theses with the actual numbers.
2026-05-15The Bitcoin Supply Crunch Is Real: ETFs Now Absorb 10x Daily Mined Supply
Post-halving issuance plus relentless ETF demand has created a structural mismatch. We unpack the math, the miner economics, and what it means for BTC pricing in 2026.
2026-05-14
Why Spot Bitcoin ETFs Just Crossed $100B in AUM and What the 10:1 Demand-Supply Gap Means
U.S. spot Bitcoin ETFs have crossed $100B in total assets and absorb roughly 4,500 BTC per day. Here is what that flow imbalance does to price, miners, and the next 18 months of the market.
2026-05-13
Inside the $53 Billion Bitcoin ETF Wave: How Institutional Flows Are Rebuilding the 2026 Cycle
Spot Bitcoin ETFs have pulled in $53 billion since launch and $18.7 billion in Q1 2026 alone. The flow profile is reshaping how Bitcoin trades : and who sets the price.
11/05/2026Ethereum's DeFi TVL Share Falls to 53%: What the Multi-Chain Shift Means for ETH
Ethereum still leads DeFi but its TVL dominance is at a multi-year low. We break down where the liquidity went and whether ETH's institutional moat protects it.
10/05/2026
Bitcoin to $85,000? Three Signals Investors Are Watching in May 2026
BTC trades above $82,000 with three independent signals, derivatives positioning, exchange supply, and persistent ETF demand, pointing toward an $85,000 target by month-end.
08/05/2026
Is the Four-Year Halving Cycle Dead? Why ETF Flows Now Drive Bitcoin's Price
07/05/2026
Why Bitcoin Q1 2026 ETF Inflows Hit a Record $18.7B : and What It Signals for the Rest of the Year
Q1 2026 marked a structural shift in how Bitcoin trades. A record $18.7 billion of ETF inflows, BlackRock's IBIT capturing close to half the market, and pension funds rising to 67% of holdings : the institutional bid is no longer hypothetical.
06/05/2026Why ETF Flows Now Outweigh the Halving: The 2026 Bitcoin Cycle Is Different
Spot Bitcoin ETFs now move more capital in a single trading session than miners produce in a week. The arithmetic of the halving cycle has fundamentally shifted.
05/05/2026$60,000 or $90,000? The Battle Over Bitcoin's Cycle Floor
Two camps disagree about where Bitcoin actually bottomed. One side says the $60,000 floor is already in. The other warns a failed $80,000 breakout sends BTC straight back to the lower $70,000s. Here is what the on-chain and flow data actually show.
04/05/2026Saylor's Cambrian Explosion Thesis: Is a Bitcoin Supply Shock Actually Coming in 2026?
At Bitcoin 2026 in Las Vegas, Michael Saylor argued that a flood of credit instruments will collide with a shrinking supply of available BTC. We test the math, list the counterarguments, and outline what would need to break for the thesis to play out.
01/05/2026
Strategy Closes In On a Million Bitcoin: Validation, or Concentration Risk?
Strategy now holds 818,334 BTC after another $255 million weekly buy. The treasury value sits at $63.46 billion and the company has produced a 9.6% Bitcoin yield year-to-date. The bull case has been priced in for years. The bear case is finally being argued seriously.
30/04/2026ETF Flows Are Replacing the Halving Cycle: Why Bitcoin's 2026 Setup Is Unlike Any Before
Spot Bitcoin ETFs now hold about 6.5% of all BTC and absorb hundreds of millions in daily flows. That has rewired the price formation mechanism that traders relied on for three previous cycles.
29/04/2026Bitcoin ETF Flows Turn Positive Across Every Window: How Smart Money Is Repositioning Into Q2 2026
IBIT alone has pulled in $3.08B year-to-date and FBTC is following close behind, but the on-chain demand picture tells a more complicated story.
28/04/2026
Why the April 2026 Bitcoin ETF Flows Look Different : A Behavioral Analysis
Spot Bitcoin ETF inflows hit roughly $2 billion across eight straight days while Bitcoin coiled between $77K and $80K. The pattern looks structurally different from 2024 : and that matters for the rest of 2026.
27/04/2026Bitcoin Technical Outlook: Why $80,500 Could Unlock the Path to $85K
A breakdown of Bitcoin's $77K-$80K compression: why $80,500 is the key trigger, where downside support lives, and what derivatives are saying.
26/04/2026Bitcoin ETF Inflows Hit $2B in 8 Days as BTC Coils Between $77K and $80K
Spot Bitcoin ETFs added another $2 billion across eight trading days, pushing combined assets above $105 billion as Bitcoin holds firm between $77K and $80K.
26/04/2026Why Institutional Capital Is Front-Running the Fed: Inside the Q1 2026 Bitcoin ETF Surge
A record $18.7B flowed into U.S. spot Bitcoin ETFs in Q1 2026, and the composition of buyers tells us more about the next leg than the headline number does.
25/04/2026
Why Bitcoin Stalled Below $80,000: Inside the April 2026 Price Structure
Bitcoin spent the week grinding between $77,500 and $78,500 after an aborted push toward $80,000. Here is what the tape, derivatives, and on-chain data say about where it goes next.
24/04/2026Tesla's $173M Bitcoin Mark-to-Market Loss: What Q1 2026 Tells Us About Corporate Treasury Math
Tesla's Q1 2026 print shows the new ASU 2023-08 fair-value accounting rules cut both ways. With BTC dipping from $90K to $68K mid-quarter, the 11,509-BTC stash booked a $173M loss even though Tesla didn't sell a single coin.
23/04/2026Inside the $292M KelpDAO Exploit: How a 1/1 DVN Broke DeFi in 48 Hours
The April 19 KelpDAO LayerZero bridge exploit drained $292M in rsETH, wiped $13B in DeFi TVL, and left Aave facing up to $230M in potential bad debt. Here is the full post-mortem.
22/04/2026
Bitcoin Halving Cycle at the Midpoint: What the On-Chain Data Really Says
Bitcoin has officially crossed the halfway mark of the 2024-2028 halving cycle. On-chain metrics, ETF absorption, and corporate treasury buying tell a story that rhymes with past cycles : but only up to a point.
21/04/2026Is Bitcoin's Four-Year Cycle Broken? On-Chain Data Says Maybe
Halfway through the 2024-2028 halving cycle, Bitcoin is up only ~15% post-halving : far below the run rates of 2016 and 2020. We look at the on-chain data, the ETF effect, and whether the four-year cycle is broken or just compressed.
20/04/2026Bitcoin Whales Grabbed 270,000 BTC While Exchange Reserves Hit a 7-Year Low : What the On-Chain Data Really Says
On-chain data shows whales accumulating 270,000 BTC in 30 days, exchange reserves at a 7-year low, and long-term holders adding $49 billion to realized cap : yet average deposit size is also rising. A closer read on the late-cycle handoff to ETFs.
18/04/2026Is the Four-Year Cycle Really Dead? Saylor, Cowen and JPMorgan Disagree
Three of the loudest voices in crypto, Saylor, Cowen and JPMorgan, offer three very different answers to the same question: does Bitcoin still follow a four-year rhythm, or has the ETF era rewritten the rulebook?
17/04/2026The Two-Speed Crypto Market: Why Institutions and Retail Are Moving in Opposite Directions
Bitcoin faces an unprecedented divergence: institutions are aggressively accumulating while retail volumes collapsed 30% QoQ. Analysis of Q1 2026's conflicting signals and three scenarios for Q2.
11/04/2026Bitcoin's $72K Rally on Iran Ceasefire: Price Action, Catalysts, and What's Ahead
Bitcoin surged to $72K following Iran ceasefire news. ETF inflows and MicroStrategy buying drive momentum. Full technical analysis and outlook.
10/04/2026SEC's Reg Crypto Framework: The Moment Digital Assets Got a Rulebook
Deep dive into SEC Chair Atkins' new Reg Crypto framework: commodity classification, safe harbors, and what it means for Bitcoin and crypto investors.
10/04/2026SEC Reg Crypto Framework: What Every Crypto Investor Needs to Know
SEC Chair Paul Atkins submitted Reg Crypto to the White House. The framework addresses securities classification and fundraising exemptions.
09/04/2026Understanding Crypto Market Cycles: How to Position Strategically
Learn how crypto market cycles work, how to identify bull and bear markets, and how to position your portfolio strategically through different market phases.
07/04/2026Bitcoin Price Prediction 2026-2030: What the Data Says
Bitcoin price predictions for 2026 to 2030 based on on-chain data, historical cycles, and institutional adoption trends. What do analysts expect for BTC?
07/04/2026